

The article provides a basic overview of the Prometheus program, including its fundamental features, capabilities, and application cases. It is intended to provide readers with an basic understanding of how Prometheus operates and monitors/alerts in various systems.
What is Prometheus
Prometheus is a powerful, flexible, and reliable monitoring solution that helps you to collect, store, and analyze time-series data from a variety of sources, including systems and applications.
Prometheus is widely used in the industry and it is a popular choice for monitoring distributed systems, such as microservices, and it is often used in combination with other tools for visualization and analysis.
All system services, network traffic, virtual servers, and websites can be monitored using Prometheus. Prometheus checks the server's services and network on a regular basis and sends the results to the control screen. In the event of a negative situation, it will notify you via email or SMS.
It can manage information such as network traffic, service status (Mysql, Apache, etc.), server infrastructure (Disk, CPU, RAM etc.), and so on.
Some Infos About Prometheus
Time Series Database
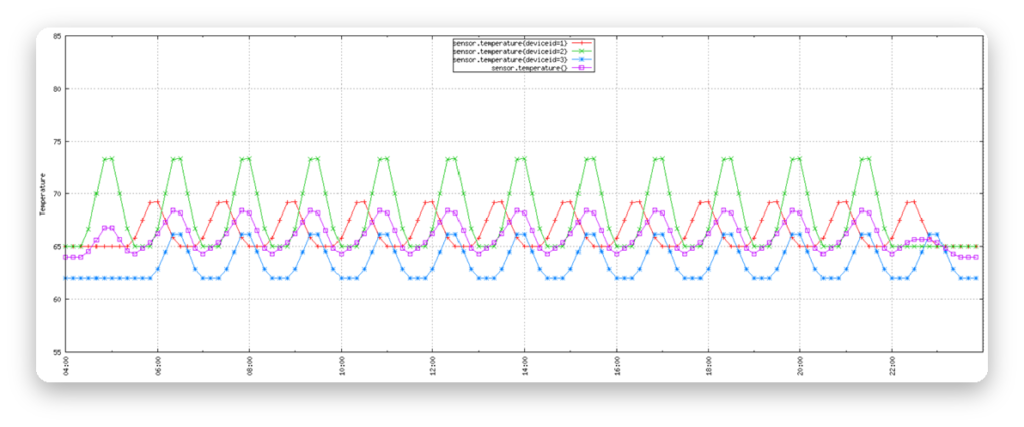
Time series data is recording how things change over time.
Open Source
Source Code is available on Github
Monitoring Software
Monitoring software observes and tracks the operations and activities of users, applications and network services on a computer or enterprise systems.
Soundcloud
Prometheus was developed at SoundCloud starting in 2012 and the official public announcement was made in January 2015.
Pull-Based Model
Instead of relying on agents to push data to the server, Prometheus actively scrapes data from target systems and applications using HTTP requests. This allows it to be more flexible and scalable, and it also makes it easier to set up and maintain.
PromQL
Prometheus includes a powerful query language, PromQL, which allows you to perform flexible and efficient queries on your data.
Why is Prometheus Used
Modern DevOps is becoming more and more complex to handle and therefore needs more automation.
There are multiple servers running containerized applications, with hundreds of different processes operating within the infrastructure. These processes are highly interconnected, making it extremely challenging to maintain such a setup smoothly and avoid application downtimes. Managing this complexity becomes even more difficult when dealing with distributed servers spread across various locations. Without proper insight into what is happening at both the hardware and application levels—such as errors, response latency, hardware failures, or resource exhaustion—it becomes nearly impossible to ensure seamless operation.
In such a complex environment, there are countless potential points of failure. With tons of services and applications deployed, a single crash in one component can trigger a cascade of failures, leading to application unavailability for users. In these situations, quickly identifying the root cause out of hundreds of potential issues is critical. However, doing so manually can be incredibly time-consuming and difficult, adding further challenges to maintaining system stability.
Where is Prometheus Used
What will make the searching the problem process more efficient would be to have a tool that constantly monitors whether services are running and alerts the maintainers as soon as one service crashes. So you know exactly what happened or even better it identifies problems before they even occur and alerts the system administrators responsible for that infrastructure to prevent that issue.
For example one specific server ran out of memory that caused database parts to fail that database was used by an authentication service that also stopped working because the database became unavailable and then application that depended on that authentication service couldn't authenticate users in the ui anymore. In this case Prometheus would check regularly the status of memory usage on each server and when on one of the servers it spikes over for example 70 percent for over an hour or keeps increasing notify about the risk that the memory on that server might soon run out.
Prometheus Architecture
This diagram below shows Prometheus's architecture.
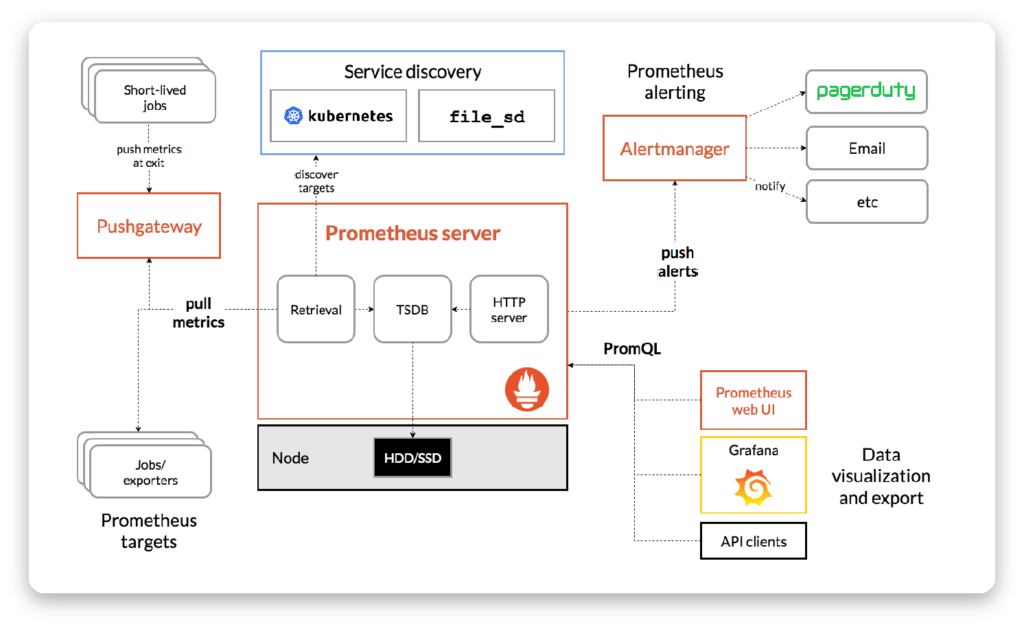
Service Discovery:
- Kubernetes: Prometheus discovers Kubernetes services and collects metrics from them.
- file_sd: Prometheus can also discover services from a static file configuration.
Prometheus Server:
- Retrieval: The Prometheus server retrieves metrics from various data sources.
- TSDB: Prometheus uses a Time Series Database (TSDB) to store the collected metrics.
- HTTP Server: The Prometheus server exposes an HTTP endpoint for querying the metrics.
Alertmanager:
- Alertmanager is a tool used to send notifications. You define rules in Alertmanager. For example, send an e-mail when the CPU usage reaches a certain level.
- Prometheus pushes alerts to the Alertmanager component, which then handles the routing and notifications of these alerts.
- Notifications can be sent via channels like Email, Pagerduty, etc.
Other Components:
- Pushgateway: Allows pushing metrics from short-lived jobs or processes to Prometheus.
- Prometheus Web UI: A web-based user interface for visualizing and querying the Prometheus data.
- Grafana: A popular data visualization and dashboard tool that can be integrated with Prometheus to create rich monitoring dashboards.
- API Clients: Applications that interact with the Prometheus API to access the collected metrics.
Grafana
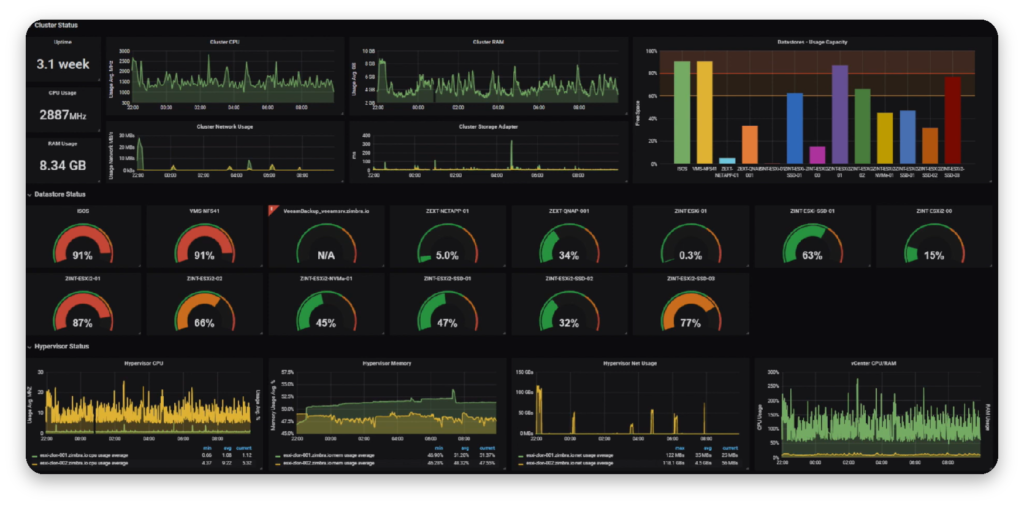
Grafana is a strong visualization and analytics tool designed to work alongside Prometheus. It allows users to collect and combine data from a variety of sources, resulting in a single view of system metrics and performance. Grafana enables enterprises to create highly configurable dashboards that combine complex data into simple, actionable insights, resulting in improved monitoring, troubleshooting, and decision-making processes.
For more detailed information, please visit the official Prometheus website.
